Data grid animations give developers an easy-to-understand spec for building dense, usable functionality.
One of the challenges of communicating usability requirements is that it's easy to write a 10-page document where it's easy to skip or miss a point. While they're no replacement for written requirements, animations convey a huge amount of information, are easy to digest, and help developers understand animation timing and feel.
The problem
Data grids (tables) are incredibly common in enterprise applications. There are best practices for data table interactions, but they are difficult to communicate succinctly.
I built these simple animations in Adobe After Effects to help show developers how to construct data table interactions. These .gif animations function as a kind of interaction requirements, making it more easier for the team to communicate user feedback and interactions.
Effective data grids are the key to usable enterprise applications.
Fixed headers solves a loss of context that comes from scrolling a data grid.
When you scroll down in a data grid, you often lose the context of the header row. A "frozen" row that contains the column names is an easy fix. There's even a precedent—Microsoft Excel has done this for years.
Clear feedback helps users wayfind even as they use the data grid.
Oftentimes it's difficult for users of data tables to know the results of their actions. Clear feedback is key. This comes not only in the form of toast messages. Feedback is also delivered via movement and animation. Combining these elements is a powerful method of delivering a clear message to a user.
A clear definition of the "indeterminate" state helps developers build usable selection functionality.
Top-level functionality is common in enterprise data grids. Indeed, even Gmail has this functionality. The complexity arrives when there is a "select some" or indeterminate state in the selection grid. Indeed, indeterminate is the most common state of checkbox selection. If the selection is more than 0 but less than "all", the selection can be said to be indeterminate. But how does this state work with actions, pageination, and other core data grid functionality? This animation offers a guide.
What about visual design? When in doubt, use Google's 'Material Design' standard.
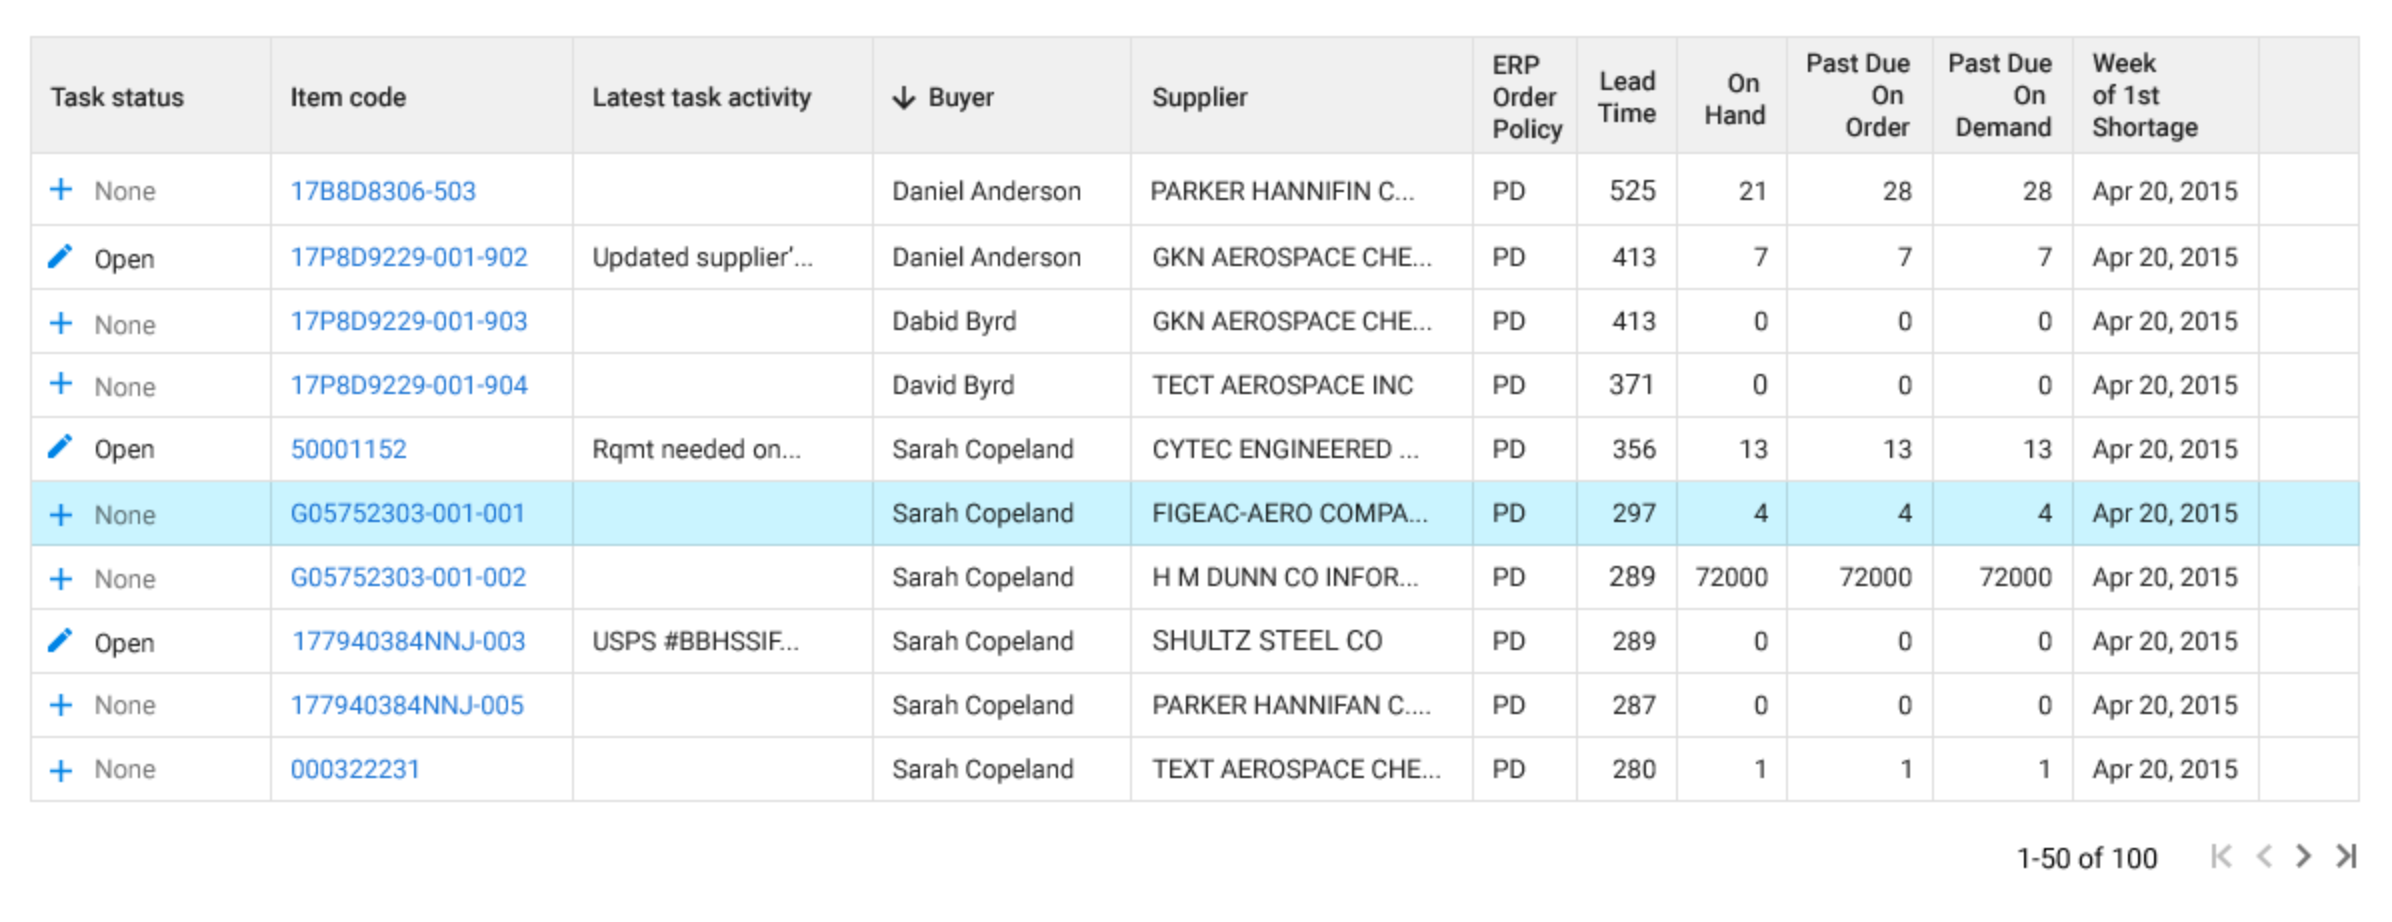
Here’s an example of a data grid in Google’s ‘Material Design’ standard.